
Persistent Congestion on NYISO’s Central East Interface: The End is in Sight | Congestion Watch Blog
The Central East Interface is one of New York’s most congested corridors, enabling Upstate generation to serve the robust load levels Downstate. Congestion on the interface and the Zone F/Zone E basis spread has increased significantly in the past 1.5 years as a result of construction on the Central East Energy Connect, one of the two projects under the AC Transmission Upgrades PPTN. In addition to construction-associated outages, higher delivered gas prices in eastern New York have contributed to increased congestion. The Central East Energy Connect strives to increase the upstate-downstate transfer of low-cost renewable generation by reducing transmission congestion bottlenecks along the Central East Interface. Project construction began in February 2021 and almost immediately exacerbated the interface’s issues; however, project completion is expected at the end of 2023, which means the end is in sight. ESAI has provided an outline of construction and expected impacts below.
Pre-construction, the interface had a total power transfer limit of 2,975 MW and was comprised of two 345 kV lines (Edic – New Scotland and Marcy – New Scotland), two Porter – Rotterdam 230 kV lines, and a collection of 115 kV lines.
In 2022, congestion levels have been extremely volatile as construction progresses, driving transmission line outages and power transfer limit reductions. In Spring 2022, Central East Interface congestion exploded with three line outages that reduced the power transfer limit of the interface to 1,500 MW. The construction process requires certain lines that make up the interface to be taken out of service, temporarily reducing the overall power transfer limit of the interface. In the Summer and early Fall months, congestion levels declined on account of key line restorations and the energization of the new Gordon Rd. 345 kV substation; however, construction on additional parts of the interface and high fuel prices in eastern New York maintained modest congestion levels.
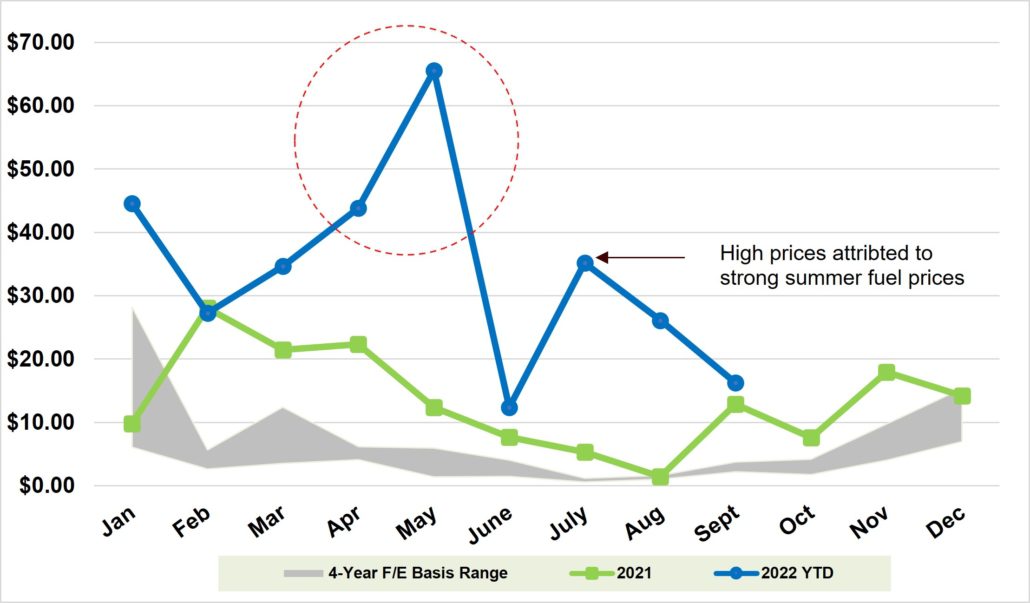
The Zone F/E basis spread strongly indicates Central East Interface congestion. Congestion on the interface depresses prices in Zone E, where the line begins, and lifts prices in Zone F, where the corridor ends. Thus, wider Zone F/E spreads is highly correlated to increased congestion. As highlighted below, the 2017-2020 historical Zone F/E basis averaged below $5/MWh. In 2021 the basis averaged near $13/MWh, and in 2022 YTD, spreads averaged above $30/MWh (peaking in the Spring). Construction impact and eastern New York gas prices have intensified since early 2021, triggering the growth in Zone F/E basis spreads. Central East Interface congestion levels and the Zone F/E basis spread is likely to continue to fluctuate through Winter 2023.
Figure 1: Monthly On-Peak Basis Spreads between Zone F and Zone E
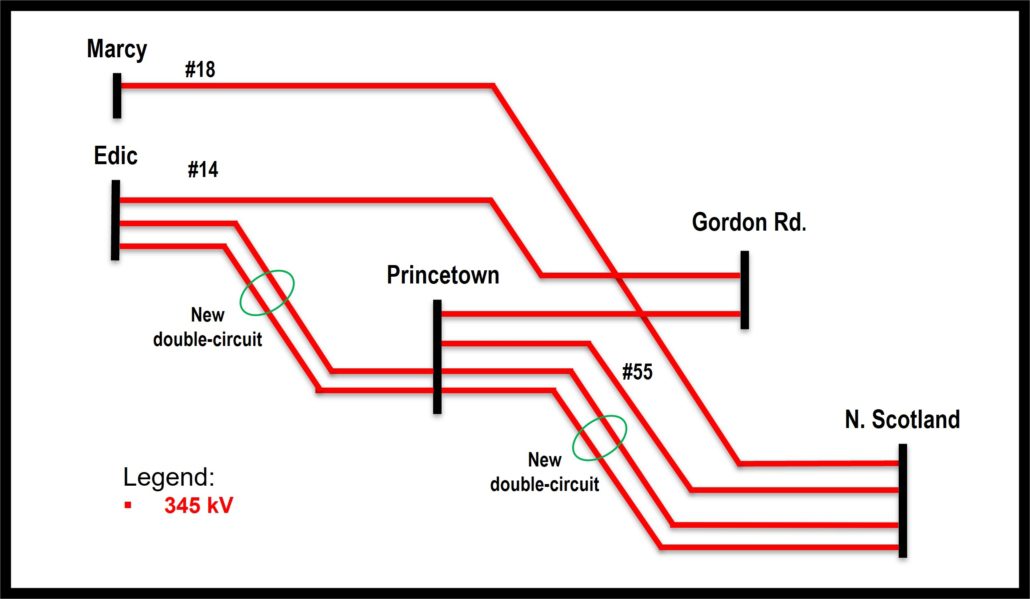
Post-construction, the interface will operate entirely as a 345 kV system with two new substations and two new double-circuit transmission lines. Power transfer capabilities on the Central East Interface will be 3,850 MW, 875 MW higher than pre-construction, easing congestion and reducing the Zone F/E basis spread. Check out the new and improved 2023 Central East Interface corridor below!
Figure 2: Central East Interface in 2023
Despite the adverse construction impacts of the Central East Energy Connect, the outcome will greatly outweigh the temporary market disruptions. It will play a key role in facilitating the delivery of upstate renewable generation to where it is needed most. Although the higher power transfer limit on the Central East Interface is expected to moderate congestion, there are additional factors to consider in the long term.
- High delivered gas prices may keep the interface congested
- Increased interface capability facilitates further development of upstate renewables. It is possible that the headroom capacity gained from the upgrade will be consumed by new renewable generation.
- New HVDC transmission capacity as part of the Tier 4 program and Offshore wind in NYC and Long Island
Find out more about congestion drivers, detailed outage information and congestion analysis for Winter 2022 and an update on the FTR auction in our recent issue of Congestion Watch.

Learn About Congestion Watch

Congestion WatchTM Ahead of each monthly Firm Transmission Rights (FTR) auction in the Northeast, our monthly congestion report provides month-ahead assessments of the congestion component of zonal LMPs for each Northeast RTO. Congestion WatchTM provides expert insights into key drivers for congestion pricing such as transmission and generation outages, system load and changes to fuel prices.
Contact Us
Please contact us for more information about our research product publications or our consulting services.
